


Seventh District Midyear Review: Economic Growth Slowed Further in the First Half of 2023
By Elizabeth Kepner, Thomas Walstrum
The pace of economic growth continued to slow in the Seventh Federal Reserve District 1 (most of Illinois, Indiana, Michigan, Wisconsin, and all of Iowa) during the first half of 2023. While total employment was still growing during the first six months of this year, the pace was slower than in 2022—and for manufacturing employment, even more so.
As demand weakened and supply chain pressures subsided, manufacturers began reporting higher-than-comfortable inventories and declining backlogs. Growth slowed as financial conditions tightened in response to interest rate hikes by the Federal Reserve and turmoil in the financial system. In this blog post, we explore these developments and consider their implications for the rest of 2023.
Growth continued to slow in the first half of 2023
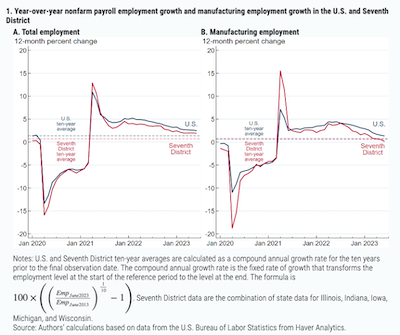 In our year-in-review blog post for 2022, we wrote that the Seventh District and the nation were slowing toward their long-run growth trends following a period of very strong activity, which took place as the economy climbed out of the hole created by the pandemic. The slowdown trajectory continued in the first half of 2023, as can be seen in panel A of Figure 1, which shows year-over-year growth in total nonfarm payroll employment for the U.S. and Seventh District. But while employment growth has been slowing, rates for the U.S. and the Seventh District remain solidly above their 10-year averages, indicating the labor market has stayed strong over the first half of the year. Panel A of Figure 1 also shows that the Seventh District’s employment has been growing more slowly than the country’s. The recent gap between the employment growth rates of the nation and the Seventh District is quite similar to the gap between their respective 10-year averages, suggesting that long-run, structural factors are behind the District’s relatively weaker growth.
A key sector playing a role in the Seventh District’s steady decline in growth (and a key sector in general for the District) is manufacturing. Panel B of figure 1 displays recent trends in year-over-year employment growth for this sector. The manufacturing sector is sensitive to changes in interest rates because much of what it produces is investment goods purchased using financing. Thus, at least part of the decline in growth shown in panel B of figure 1 can be attributed to rising interest rates. Manufacturing employment growth was particularly weak over the first half of 2023: Between January and June of this year, it increased 0.03% in the U.S. and decreased 0.39% in the Seventh District. The relatively worse performance for the Seventh District shown in panel B is not in line with the historical gap between U.S. and District manufacturing employment growth, but it is too soon to know what might be driving the larger-than-average gap.
Supply chain pressures have eased considerably
 Two of the largest production challenges to emerge during the pandemic era were shortages of a wide range of inputs (such as microchips for autos) and congestion in the freight transportation system (such as at the ports in the Los Angeles area).
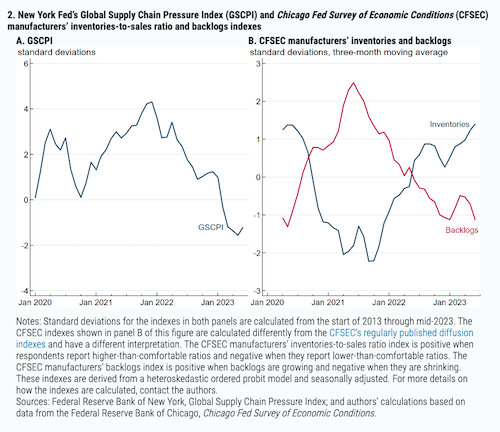
The effects of these supply chain issues are clearly visible in Figure 2. Panel A of this figure shows the Federal Reserve Bank of New York’s Global Supply Chain Pressure Index (GSCPI), which summarizes several supply chain metrics with one number (positive values indicate above-average supply chain pressures, while negative ones indicate the opposite). The GSCPI peaked in late 2021 and has been trending downward since then. Moreover, the GSCPI dropped below zero in early 2023 and has stayed negative this year, indicating supply chain pressures have eased significantly and are now below average.
Data from the Chicago Fed Survey of Economic Conditions (CFSEC) tell a similar story. Panel B of Figure 2 shows indexes of manufacturers’ inventories-to-sales ratios and backlogs from the CFSEC; the inventories measure is positive when stocks are higher than comfortable, while the backlogs measure is positive when backlogs are growing (see figure 2’s notes for more details). The path of the backlogs index is similar to the GSCPI, but the backlogs index’s peak was about six months earlier (around mid-2021). Inventories, meanwhile, were very low for all of 2021 and reached comfortable levels (i.e., the index was near zero) around mid-2022. Currently, inventories are quite high and backlogs are shrinking—both signs that supply chain issues are not holding back production and that demand has softened.
Credit conditions are tightening
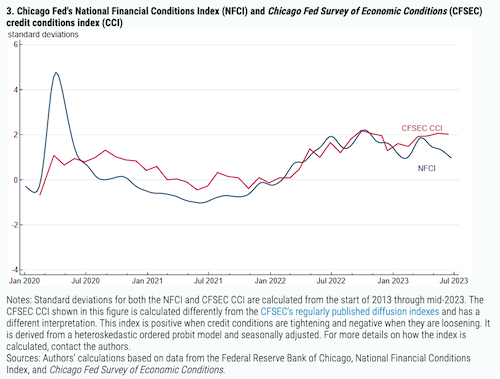 One reason employment growth slowed and supply chain pressures eased in the first half of 2023 was tightening credit conditions. When credit conditions tighten, there is generally weaker demand for investment purchases such as real estate and factory equipment. Figure 3 plots the recent history of two measures of credit conditions: the Chicago Fed’s National Financial Conditions Index (NFCI) and the CFSEC credit conditions index (CCI)—both scaled so that positive values indicate credit conditions are tightening and negative values indicate credit conditions are loosening.
While the NFCI summarizes a set of national financial market indicators, the CCI is based on responses to a survey question about how Seventh District respondents’ credit conditions have changed. Despite coming from different sources, the NFCI and CCI have had very similar paths over the past three and a half years: Credit conditions tightened at the beginning of the pandemic but loosened through much of 2021. Conditions started tightening again in early 2022, around the time that the Federal Reserve started raising interest rates. Rising rates have contributed to tightening conditions throughout 2023. Another factor that may be reducing access to credit is the financial system turmoil following the failure of Silicon Valley Bank in March of this year. While the NFCI and CCI both showed stronger tightening around that time, the increases in both indexes were not large. The NFCI has since returned to its prior level, while the CCI has not. One possibility for the divergence is that CFSEC respondents have been more affected by the financial system turmoil than the broader set of financial sector indicators included in the NFCI, though we cannot know for sure. Despite their recent differences, both indexes suggest the impact of the financial sector turmoil on credit conditions has been limited.
Conclusion
Because the first half of 2023 was largely a continuation of 2022’s trends, our conclusion is quite similar to the one from the previous economic update. As we wrote then, some observers (including some Blue Chip forecasters4) have predicted a recession for the U.S. in the second half of 2023. While growth continues to slow—particularly in interest-rate-sensitive sectors, such as manufacturing—neither the U.S. nor the Seventh District are in recession yet, and there is still hope that even if growth in overall economic activity falls below its long-run trend during the remainder of 2023, it will stay positive.
INDUSTRIAL SUPPLY MAGAZINE


The March/April issue of Industrial Supply magazine features an in-depth cover story about Joyce Lansdale and Vallen. Plus, we're featuring articles by contributing writers Dirk Beveridge, Frank Hurtte, and David Kahle, as well as interviews with numerous product and distribution industry experts.