


MITS updates analytics solution
MITS, a provider of reporting and analytics solutions for distributors and manufacturers, unveiled MITS Discover 11, the latest release of the company’s self-service analytics product.
With enhanced data integration capabilities and a streamlined new user interface, MITS Discover 11 addresses the growing need for faster data discovery and improved decision-making across all roles within a distribution operation.
“What is important in our business is our time and the speed of information access,” said Wes Hofkamp, vice president of operations at Johnstone Supply, Sioux Falls. “There is a heavy cost—both short and long-term—if our team can’t get the information they need quickly. MITS Discover 11 helps us be more profitable by delivering data faster, cleaner, and more accurately to every user, not just the tech-savvy ones.”
MITS Discover 11 includes three new data integration capabilities that maximize the ability of any single report or dashboard to deliver actionable information.
Users can mix and match data from multiple cubes, easily adding columns from multiple data cubes (such as sales, inventory and purchasing) to a single report, providing a comprehensive picture of any opportunity, trend, or issue.
The program allows users to mix and match data types, incorporating trended and static data on a dashboard or scorecard with tighter integration between MITS Discover 11 and an updated release of MITS’s reporting product, MITS Report 4
Users can also mix and match date ranges, comparing data sets over different time periods in a single dashboard object.
MITS Discover 11’s new streamlined user interface makes it easier to explore data from a single report screen for faster decision-making. Key enhancements include dynamic data exploration, enabling users to quickly explore and interrogate data from a single report screen with a new breadcrumb trail capability and drop down drill path modifier; Quick Calculated columns to add calculated columns for percent of total, or trend or difference of a column from the prior period or same period prior year; a visual refresh of the MITS Discover user interface that includes a more responsive design.
INDUSTRIAL SUPPLY MAGAZINE


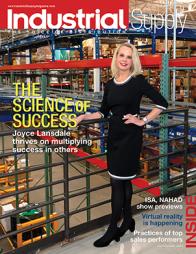
The March/April issue of Industrial Supply magazine features an in-depth cover story about Joyce Lansdale and Vallen. Plus, we're featuring articles by contributing writers Dirk Beveridge, Frank Hurtte, and David Kahle, as well as interviews with numerous product and distribution industry experts.